What is the organization responsible for the ODK project? What sort of work do they do? What is your role?
This ODK project is part of a wider project, in which several research institutes in Mozambique work together (Wageningen University (WUR), Universidade Eduardo Mondlane (UEM), Universidade Eduardo Mondlane (UEM), Instituto Superior Politécnico de Manica/Gaza (ISPM/ISPG) and Resiliencia Mozambique )
All of the above institutions work together on FArm-led Smallholder Irrigation project in MOzambique (FASIMO), of which part of the outcomes is developing a methodology for mapping irrigated agriculture in Mozambique through remote sensing and machine learning (this ODK project). I am currently doing a PhD at Wageningen University about this topic, and the other collaborating institutions support me. UEM does agricultural research and INIR is a public institution attached to the Ministry of Agriculture that works on irrigation, and want to develop internal capacities to do field data collection for classification studies based on remote sensing. One of the outcomes of FASIMO is that INIR and UEM gain the capacities to map irrigation initiatives throughout Mozambique (currently outside of the scope of the project). Resiliencia Mozambique coordinates the gathering of field data for this project, as I am currently in the Netherlands. INIR and UEM have the capacity to grant approvals for data collection.
What is the goal of the project?
This ODK project has two goals: for this season (April-November 2020) to try out remotely managing field data collection, and for the next season (2021) scaling this process up. By the end of my PhD, the university and irrigation institute will have the knowledge and models to collect field data, analyse it and make thematic maps of each irrigation season.
How many people are involved in the project? How many enumerators or field data collectors?
This irrigation season (April-November 2020), 5 people are involved (3 field data collectors, 1 manager for data collection and me), the season of 2021 is expected to have many more data collectors and 2 managers, as we will have more experience then. We will also include training on how to collect data and other issues (more later).
What is/are the geographical region(s) where ODK is being used?
The project is focused on two provinces: Gaza and Manica. Initially, only 4 small areas are tested (2 per province, just over 1200 km2 per area), however by the end of this project, the whole region is mapped (75,709 + 62,272 km2). Over 130 times the size!
The terrain included mountains, rivers, lakes, forests, ocean/beach, and drier areas. Agriculture is both irrigated and rainfed. There are not always roads, and public transportation is sporadic, so fieldwork requires a motorbike (which is also quite difficult to get in Gaza). A test during the last 2 weeks showed that it is only possible to gather around 8 samples per day, due to long travel times (distances are oké). Wifi is also not the strongest, so data is uploaded sporadically.
What is the time frame of the project (eg days, weeks, years), or what determines when the project will be done?
My PhD began in 2019, but fieldwork did not start until one month ago. Next year will be the second major field data collection period. Budget is what determines when enough points are gathered, as the area is so large I expect we can never have enough points.
What ODK tools do you use and which features are most useful to your project?
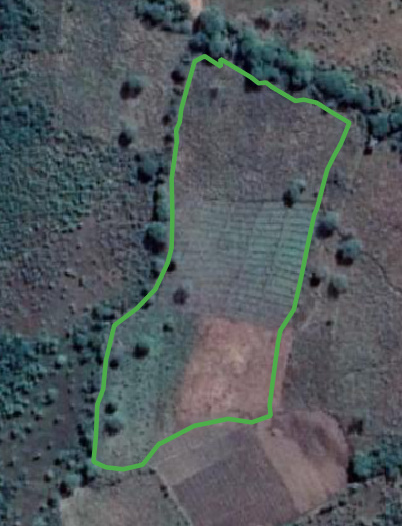
I use ODK central to gather all my data, excel to make my forms, and the smartphone ODK app for data collection. Specifically, I am interested in photos of crops and land covers, GPS locations of these photos, GPS locations of fields (polygons), and some basic information such as irrigated or not, crop type, etc.
What other non-ODK software do you use that might be of interest to the ODK community?
Once the data is in ODK central, I use ruODK to download all the info and process the information. I use R, as I like to automate most of the processes, and to be able to work in pipelines (so data in, something happens, information out, without me interfering).
Other interesting software could be Google Earth Engine, which can be used to show the polygons and process the satellite images. And QGIS of course.
Can you give an overview of what the regular daily/weekly schedule is for your project? How do you go about acquiring, transmitting and analyzing your data? etc.
For now, the field data collectors collect data daily for two weeks. The upload when they can, or as soon as wifi is available. This means I may have to wait two weeks for the data to become available for me. Then I will analyse the data for one/two weeks and adjust the form or ask the collectors what could be clarified from my side. If a training is needed, I try to give it (remotely). Depending on budget, I repeat this process.
What have been the greatest successes in your project?
This is a relative new ODK project, so the biggest success is that it works so far! Due to COVID I cannot collect the information I need, but through this route I can gather some data at least. It is also easy to scale this process up: new collectors get their own QR, follow a training and can collect data.
What are the biggest technical and/or logistical challenges in the project?
Logistics
Mainly getting to the points. I have place random points (in clusters) for which I need the data, and I did not take the road network into account (to minimise bias in the machine learning process). So it might take some time to get somewhere. I clustered the points to minimise the initial travel time; the points are all withing 2 km of each other, per cluster.
Technical
Wifi. It takes some time to upload the images and polygons.
Understanding
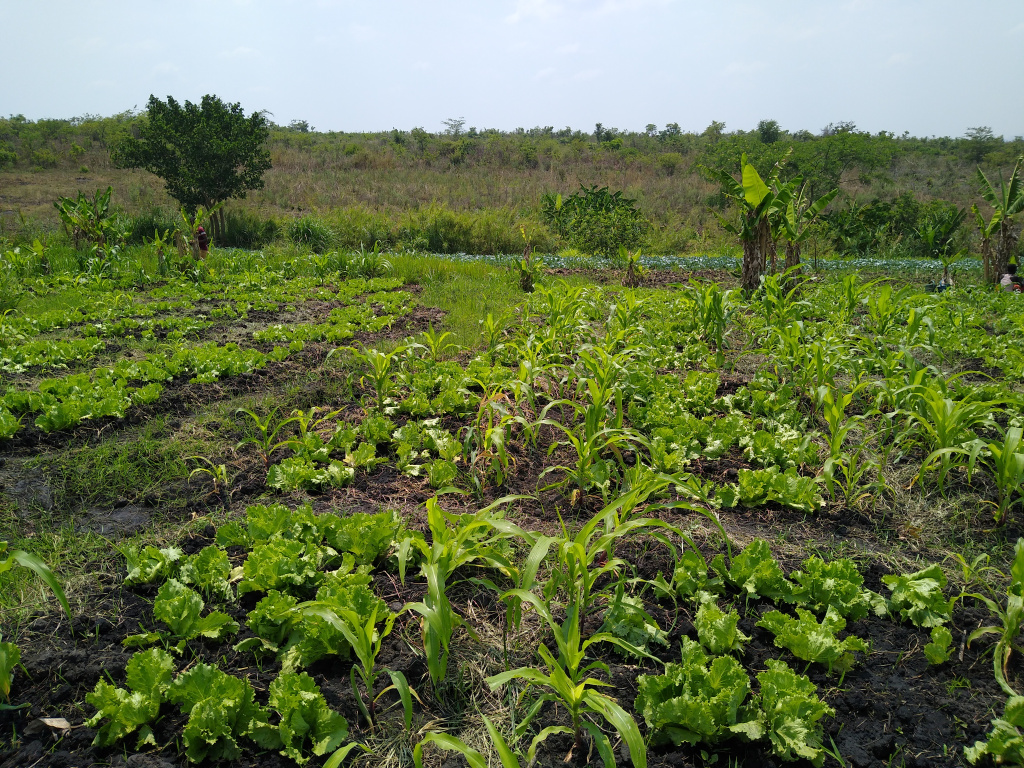
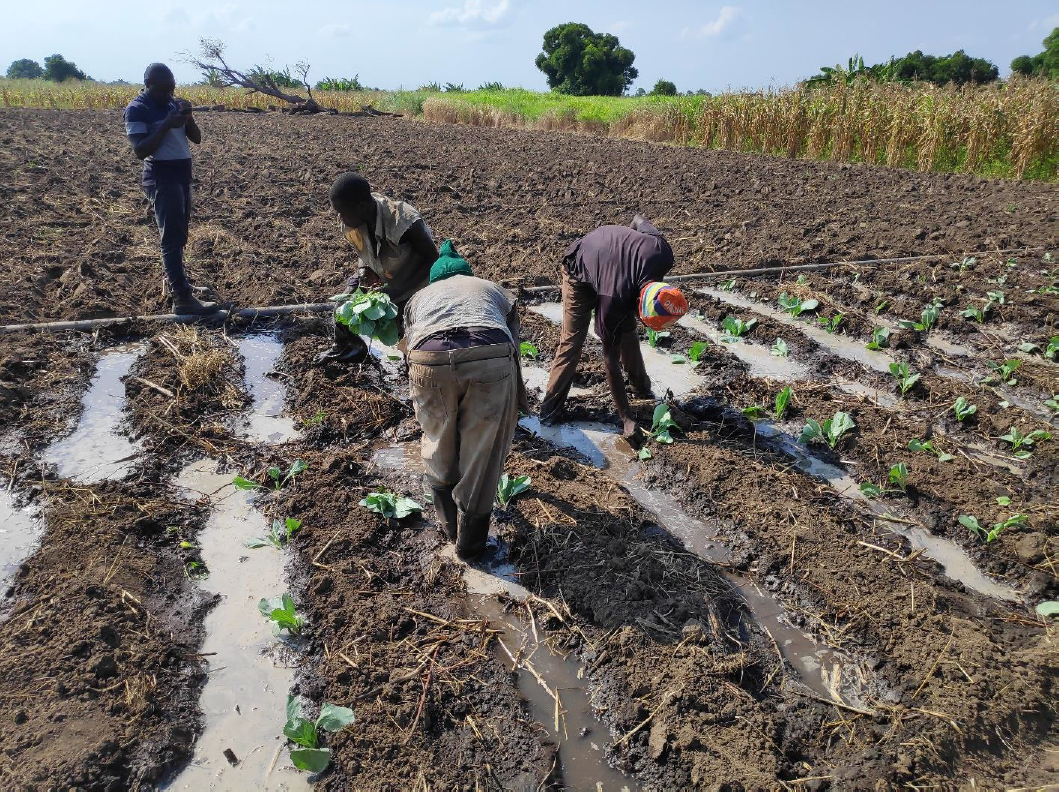
Finaly, it is difficult to train from a distance, specifically on how the data collectors interpretate the questions. For example, the image below can be interpreted as many small fields of single crops, or one field of multiple crops. Also, what would be the boundary of a field for example (although the GPS accuracy (<10 m) and satellite images pixel size (10 meters) are larger than the human error in walking along the edge of fields (<1 meter), so this is minimal)
Here is much more information on collecting ground data, which I highly recommend: https://github.com/radiantearth/ground-referencing-guide/blob/master/ground-referencing-guide.rst