Hello everyone! I am a part of UW Impact++ team, and we are trying to make something useful for the ODK community!
We noticed that there are a lot of insights that can be discovered from the audit log files associated with the submissions (such as how long each question takes and so on). And we are trying to build something that can take in the csv file that contains the audit log, and produce something that will be useful for you.
Exactly how this gets built depends on all of your voices and inputs!! For example, we still haven't decided on the exact format of the software we want to build. Since the audit file contains very sensitive information, we want to make a local app running on the desktop, rather than creating a web app.
There are a couple of options here:
build a plain simple python script -- this assumes people are comfortable with command lines.
build a JAR with some frontend such as buttons and interface for uploading the file
Make a webservice that only displays a javascript frontend, and the data doesn’t go to the server and is processed locally. (Using something like Vue or React?)
Also, how complicated this software ends up being and what analytics it comes with also depends on our ODK community! Currently we have a python script that takes in the audit.csv file and outputs the average time of filling out each question by the data collectors.
Please let us know any ideas you have with respect to the scope and the format of this software. We are trying to make sure what we build would actually be useful to our community. Thanks a ton!
A number of scenarios from the audit log file could be very useful in understanding data collectors challenges, behavior or "tricks".
One useful output is being able to identify a trend on responses i.e time taken to administer a survey. It could be possible to tell if the data collector is entering data from recall or interviewing someone.
Researchers could also be able to potentially identify questions field staff could be having problems with by looking at time taken.
I hope the proposed app/tool will provide graphical output to monitor trends.
Hello Paul! Thank you so much for your thoughts!! I don't know if I completely understand it, but here is my understanding of your ideas:
it would be cool to generate a plot of how long a survey takes to completion as y-axis and the survey number as the x-axis? That is, the plot will show that the first survey takes 1 minute to complete, second survey takes 2 minute, third survey take 1 minute, and so on.
This can also be extended to individual questions -- to see how long each question takes to be answered as more and more surveys are being collected.
One other thing, the audit log (I hope) documents a data collector going back and forth changing responses. I wish the proposed tool can be able to also show this in a useful way.....
Thank you for mentioning this! We are currently flagging the questions whose answer gets changed a lot, but in the future we want to support flagging the data collectors that change answers frequently.
Also, we are trying to have a prototype ready in a couple of weeks. When it is ready, would you like to our first test user? We greatly appreciate your involvement!
@hugh_sun thanks for starting this, analyzing the audit log is something I definitely would like to explore, but I am lacking the time and resources to do so. In general it think this is very important to objectivise how forms are filled out. I fully agree with all great @paul_macharia's suggestions.
A few additions, elaborating around what has already been mentioned, split between indicators related to
individual questions
identify questions for which answers are regularly modified by data collectors
From a data management perspective this may indicate that the phrasing of the question / answers is too ambiguous. This would lead me to consider the quality - accuracy- of the answers as not very high and be very cautious when interpreting findings related to such a question.
identify questions which take more time for data collectors to answer, as this could allow to improve forms / focus on where bottlenecks have been identified. When you have several questions around the same thematic and need to prioritise, this indicator may help to make operational decisions
identify if an answer was modified a "very long time" after the first entry (very long time depending on what is defined as acceptable by the context of the study), e.g. it could be any modification occurring after a few seconds if you are trying to collect timings, after 1h or on a different day in other data collection
identify if a question that should be answered at a specific location was not answered where it should (could also help identify if the survey is completed from recall vs. while interviewing a respondent or if an observation was not direct)
sequence of questions / filling behaviour
as mentioned by Paul an analysis of the timing patterns (between questions and time between filling two forms) could allow differentiating between a survey completed from recall vs. a survey completed while interviewing the respondent. I would expect somebody filling in the survey from recall to have a much more regular timing patterns than during a real interview, but my intuition may be wrong and it would probably be useful to generate some test datasets (interview / recall) and if we go for something more sophisticated you could probably use some machine learning algorithms to learn the difference between the 2 groups.
identify if all questions have not been answered in the same location when they should, or have been answered in the same location when they should not
place triggers about question sequence that would be suspicious (for instance it would be quite suspicious to go back to question A after having answered to question F, K and M)
model a standard filling behaviour based on collected submissions and detect outlier submissions (again I feel machine learning algorithms could be helpful here)
data collector
identify data collectors who present filling behaviours that deviate from what is defined as acceptable by the data collection requirements
identify data collectors who have very good command of the tools and seek feedback from them / ask them to train other data collectors
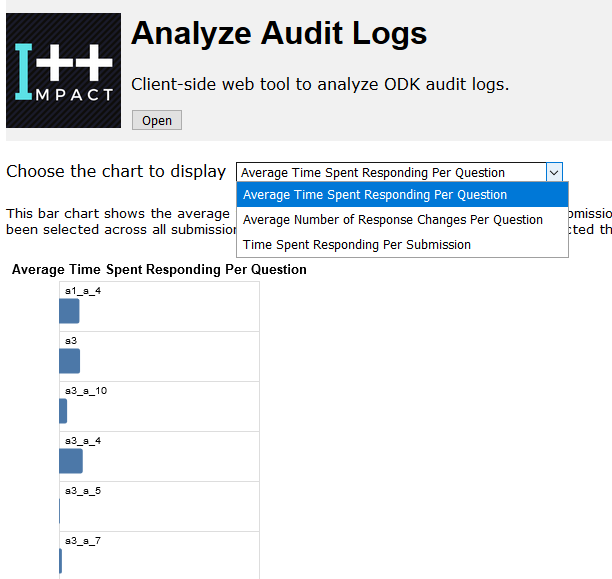
Hello, Paul! As of now, we have a working prototype of this audit log analyzer here! The direction of how to use this software is included in the README section of the repo. Of course, right now we don't support many features, but we will continue to develop this in the Fall quarter (Our club takes a rest during the summer).
Please take a look, and let us know ANY feedbacks you have! (you can either start up a new issue in the github repo, or describe your feedback in this thread. We will follow up on these threads when we can!) @Thalie@paul_macharia
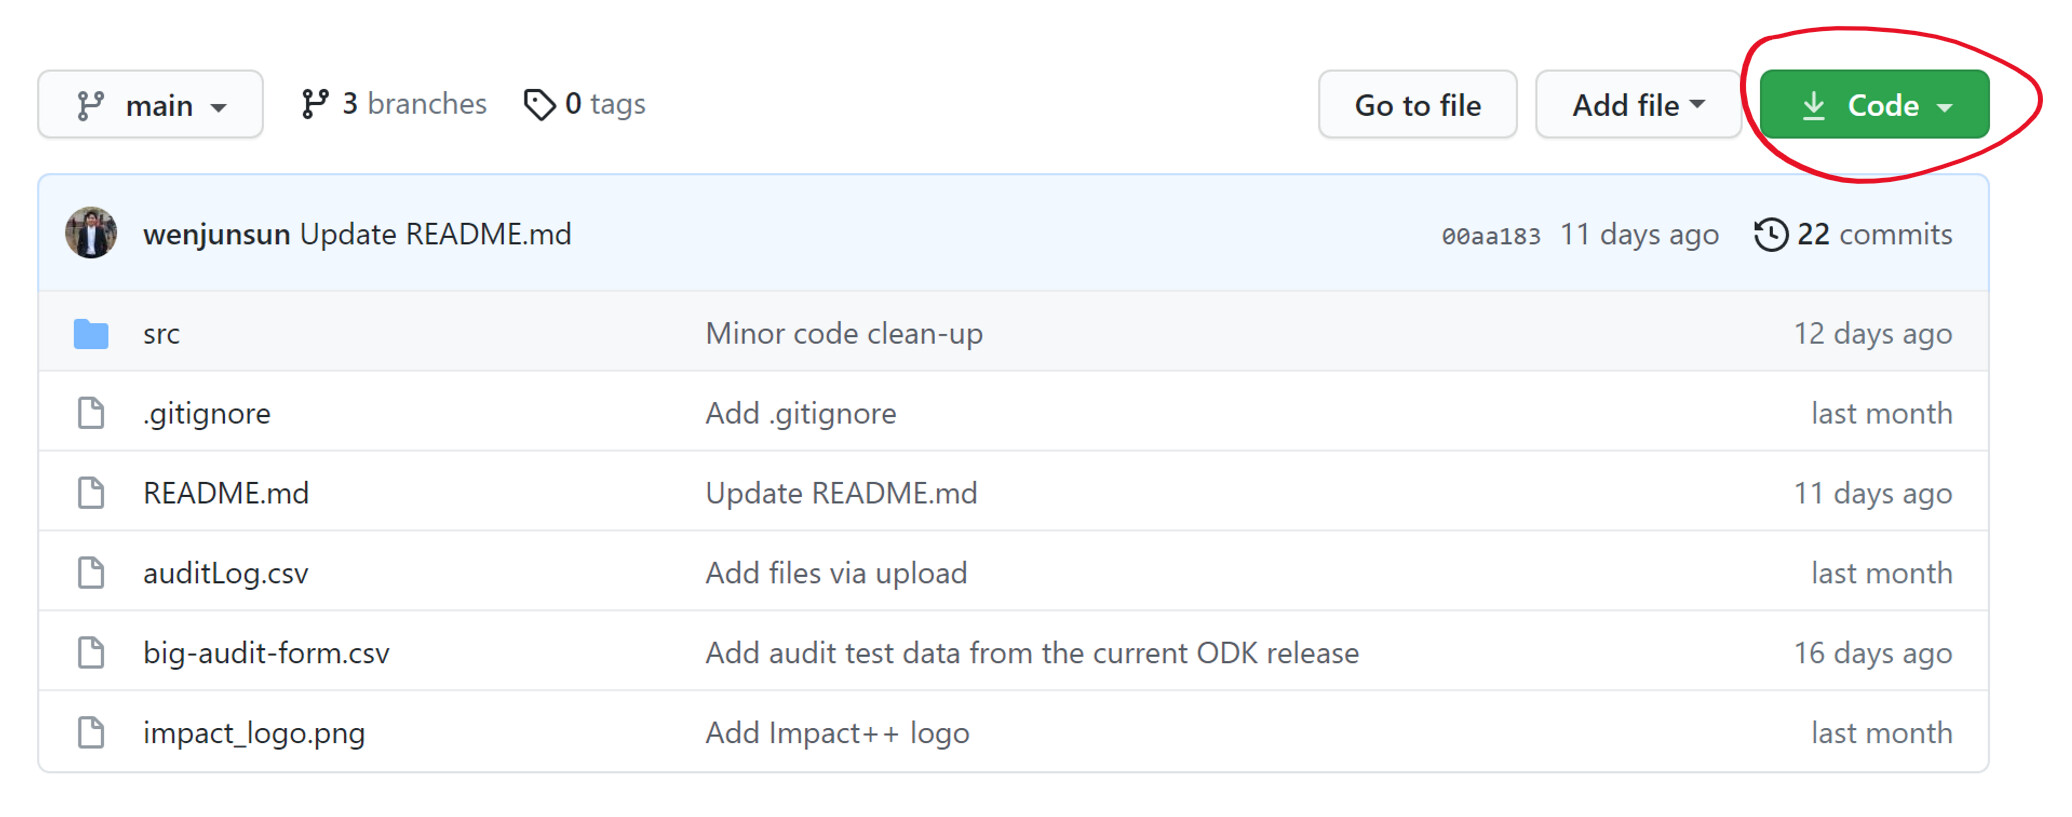
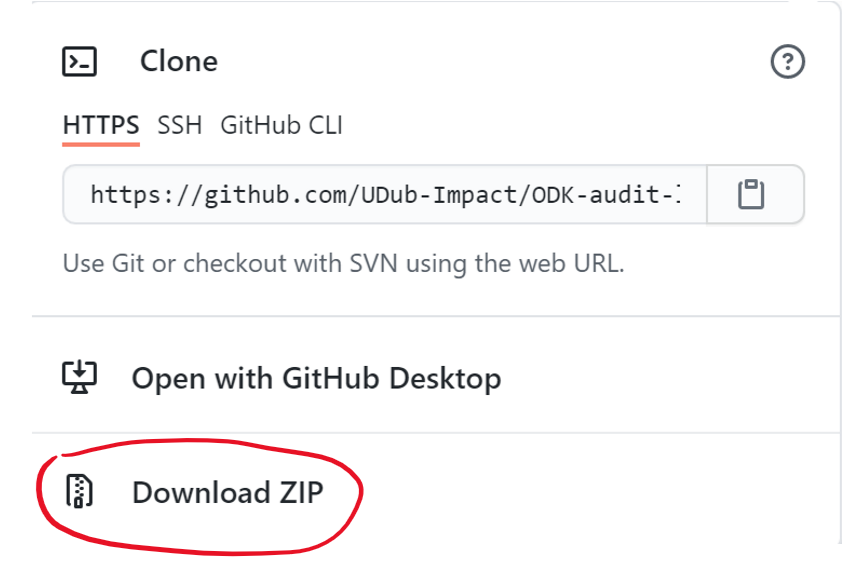
I have been hoping to try this out. However, I don't know how to "clone the repo" the first step on how to setup the analyzer (sorry I am not a GitHub expert). Maybe you could provide a step-by-step on this?
Then, unzip the zip file you download. This will produce a file that contains our code. Go to directory ODK-audit-log-analyzer-main/ODK-audit-log-analyzer-main/src and click on "main.html" to try out the analyzer!
I succeeded to download the analyzer. However, I seem not to be able to load the audit file. I don't seem to see the drop-down menu (looks like its not loading). Please find attached and try let me know what could be the problem.
Since it works fine for me, I compared our two audit.csv structures:
I have the following CSV structure: instance ID,event,node,start,end,latitude,longitude,accuracy,old-value,new-value
that I generated using the audit parameters track-changes-reasons=on-form-edit track-changes=true
while I see on your side that your structure does not have track changes instance ID, event, node, start, end,,,,,
I think the analyzer should ultimately be able to work with different audit formats such as the one you provided (even though the available indicators may vary), but this may be the reason why you are not able to upload your audit file in the analyzer.
@hugh_sun
It is a really nice start and very promising, I only looked at an audit file generated using some dummy data, but I must say I am quite excited to look at the data collected by our research assistants to see what the trends are for the different questions.
A few quick suggestions / comments:
I would have the scale at the top of the screen rather than at the bottom or even better since the list can be really long I would ensure that the scale is always displayed on screen
it may be handy to have the option to sort results by descending order (so that the questions or submissions that took the longest or have the most number of changes appear first)
time spent responding per submission: in the studies I am involved in, there will be ~40,000 / 50,000 submissions in total, so in this specific context the list can become really long
Thalie is right, our app currently only supports a certain format of the audit.csv file. So to use it @paul_macharia, you have to use certain audit parameters Thalie mentioned above to obtain a specific format of the audit.csv file. We will later try to make this app so that it can support multiple audit.csv formats.
And thank you Thalie for the advice!!! We will come back to your suggestions to make this app better in the fall. (because we are a part of a college club, we are now taking a break during the summer)
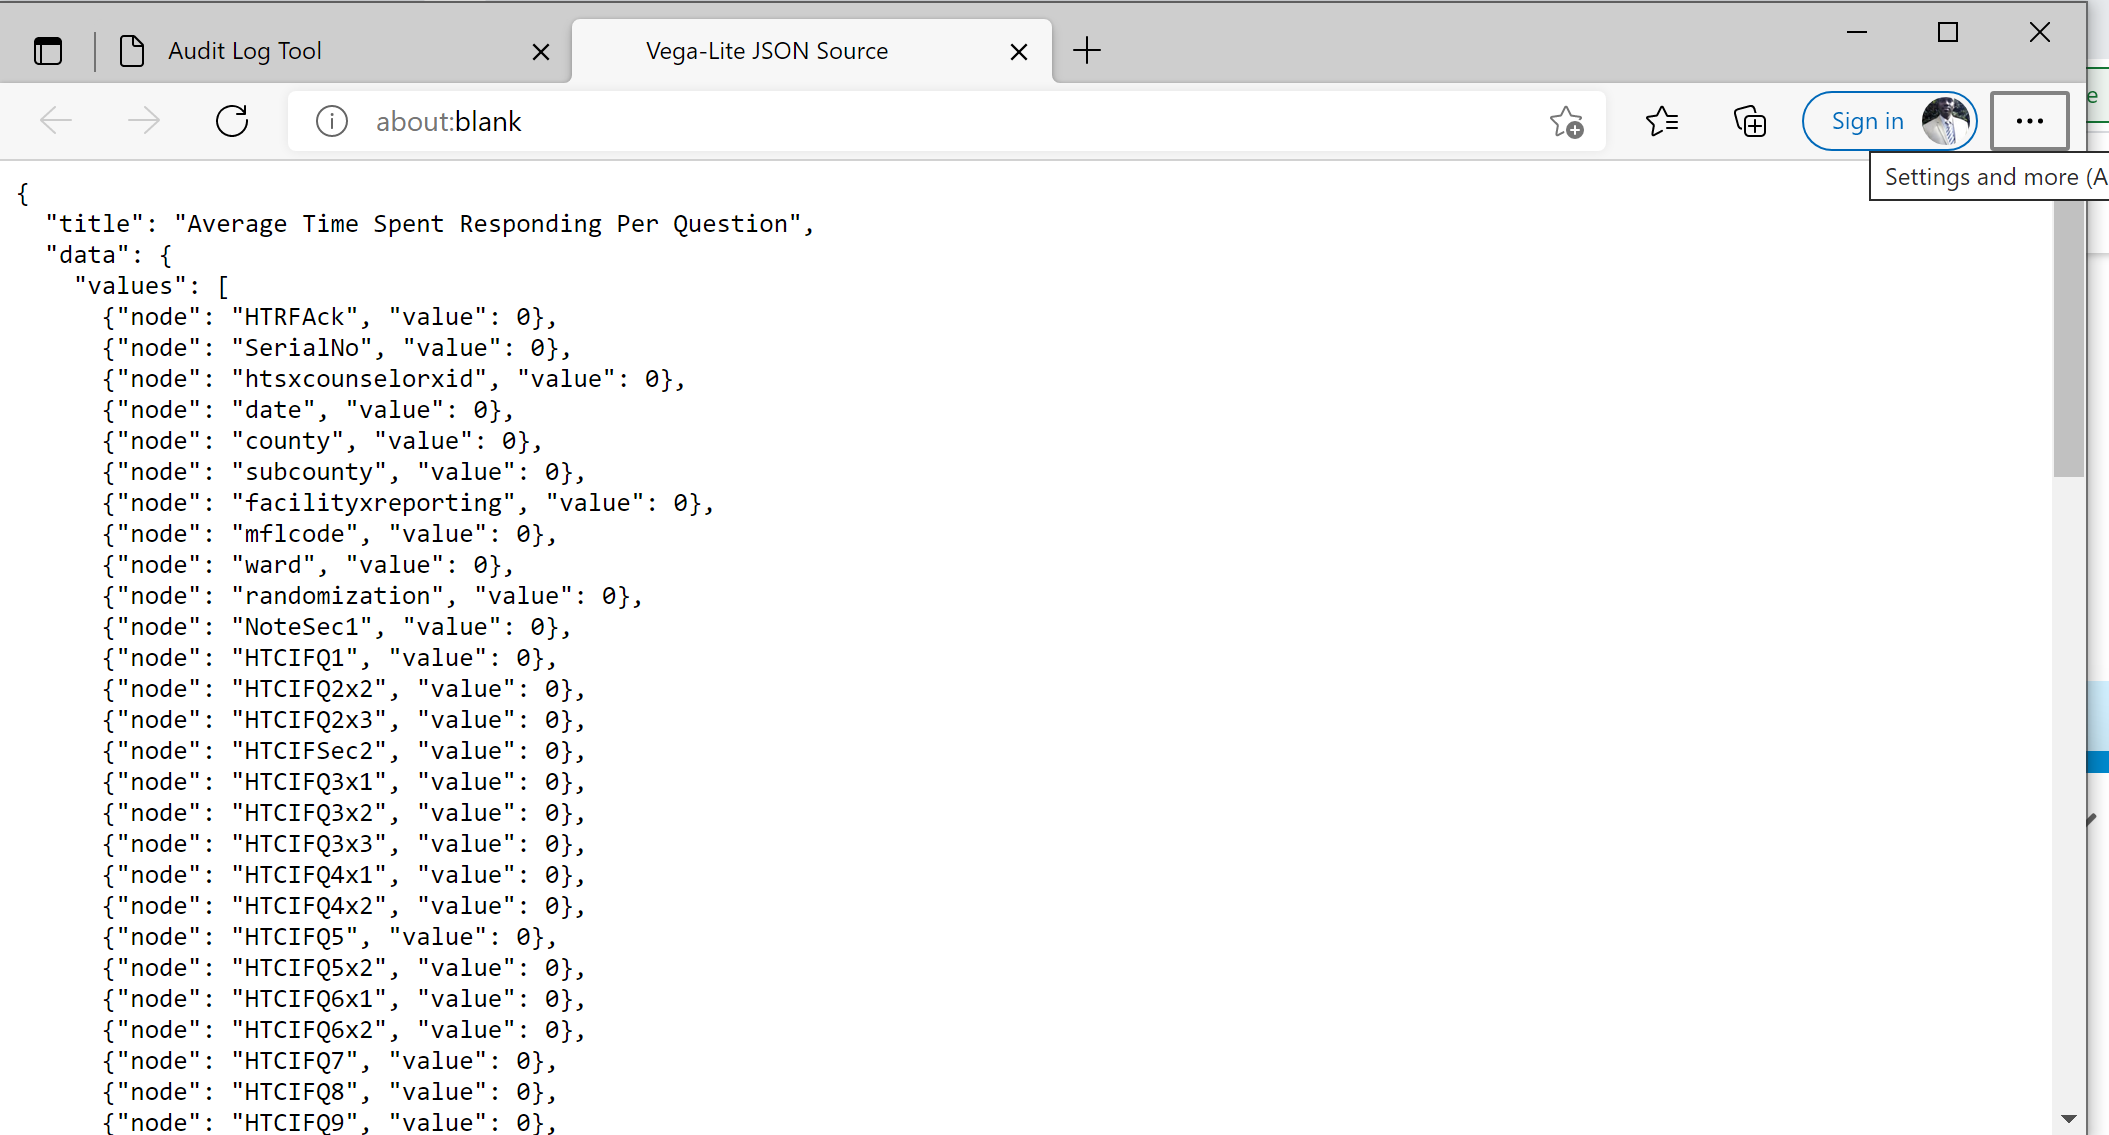
However I discovered something; there could be a bug/malfunction in the analyzer. I copied a small part of my audit file and created a file. Although the file was loaded, no values/graphs were loaded. When I view source" the values are "0"
Hello! My name is Sam and I am taking over as the new project manager of the Impact++ team from Hugh. We are in the process of finishing onboarding a lot of new developers and I wanted to give an update that we are continuing to work on this Audit Log Analyzer project. We will post updates as we take some of the suggestions posted above and I would love any feedback people have as we progress!