Hi @seadowg
Here are some screenshots.
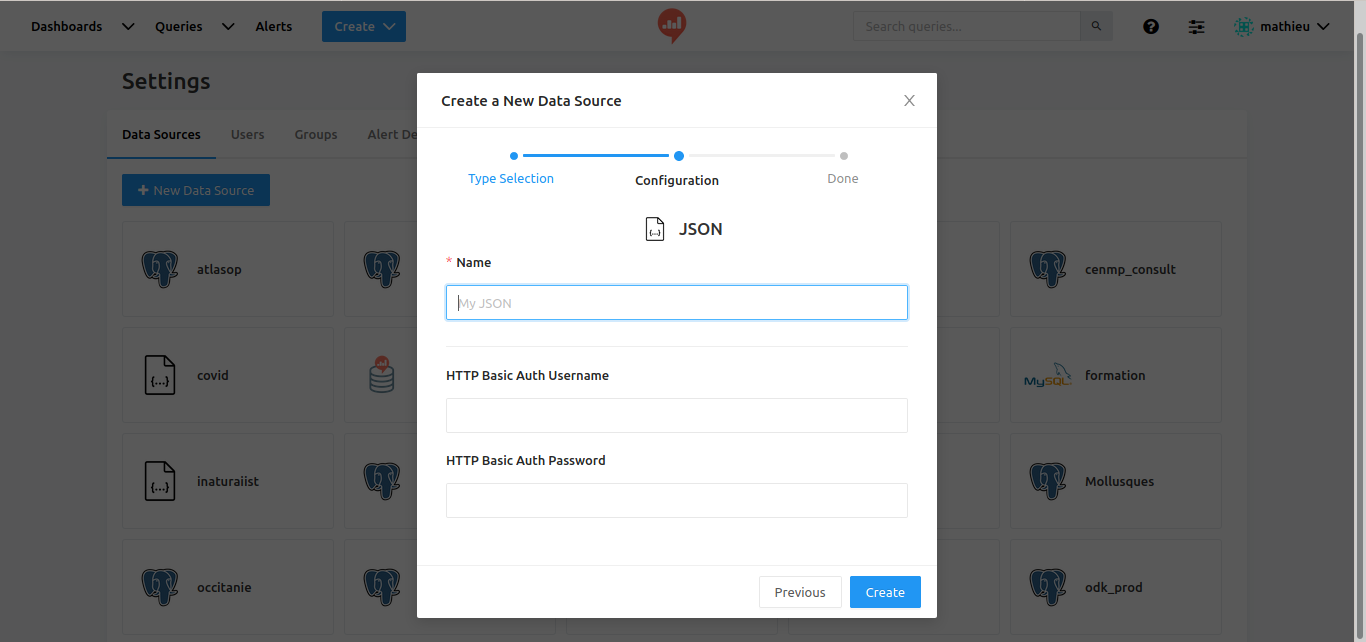
First you need to create a data source, here a json one which just allow to pass credentials.
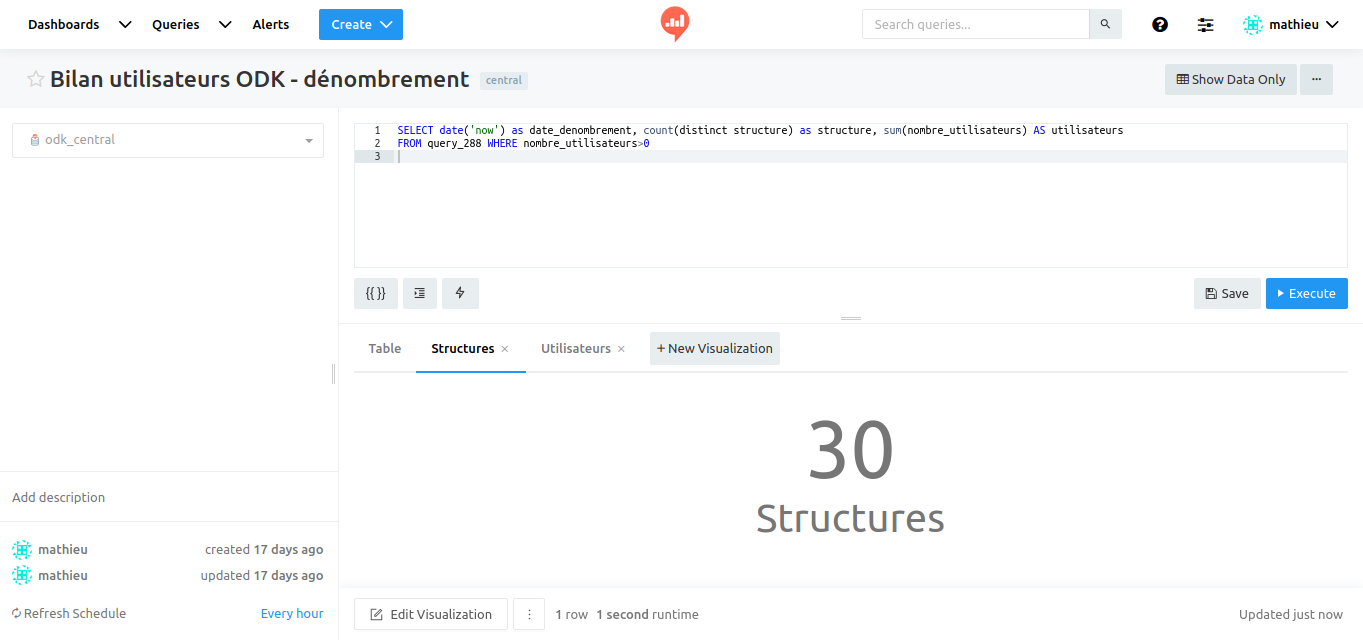
Over this data source I can now create a query :
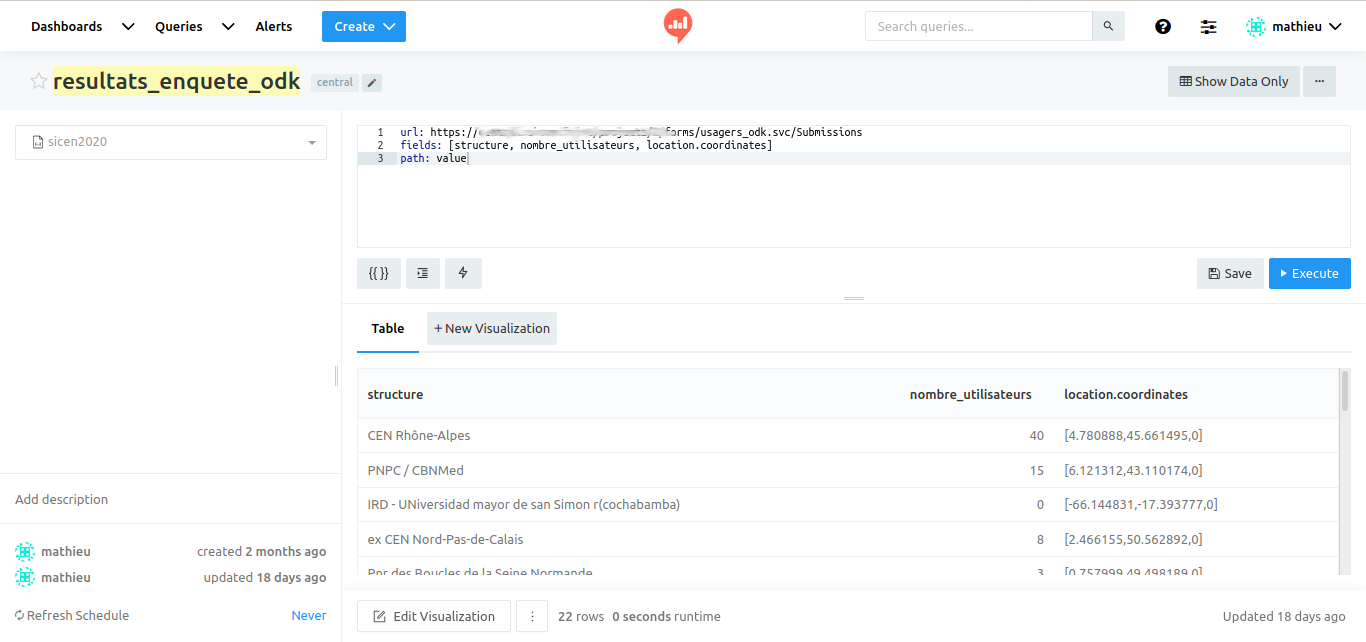
I can now already create a visualization table with for example the user count per organism
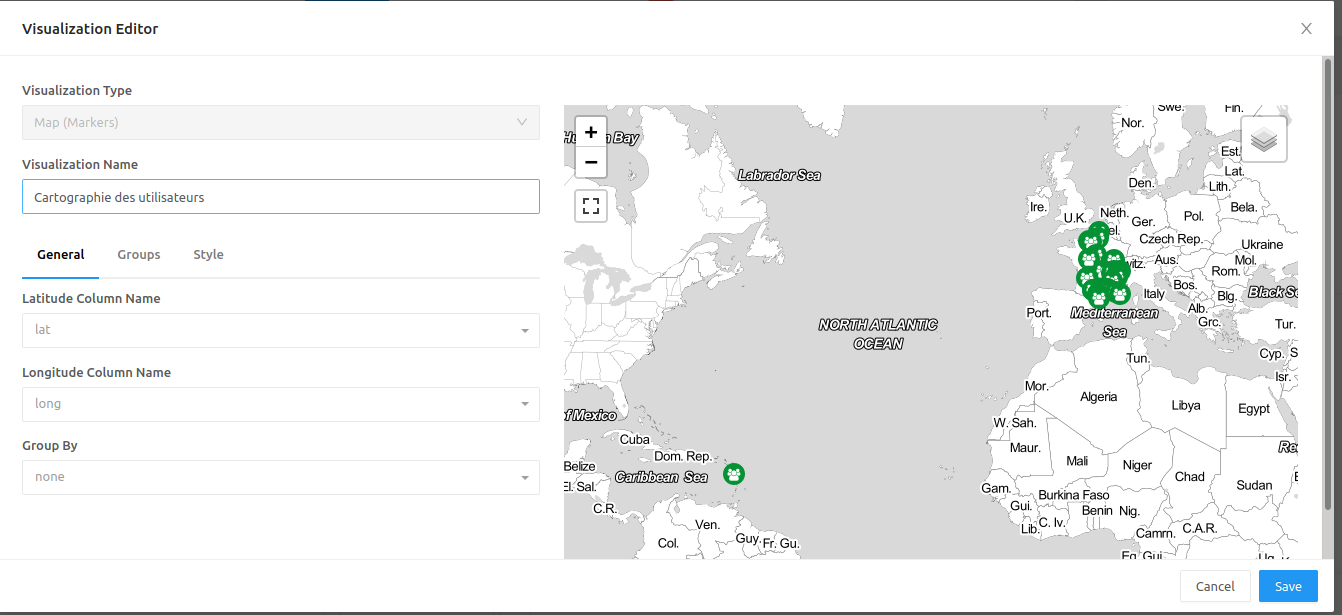
In my case, I will have to add a step to extract location coordinates from a json element.
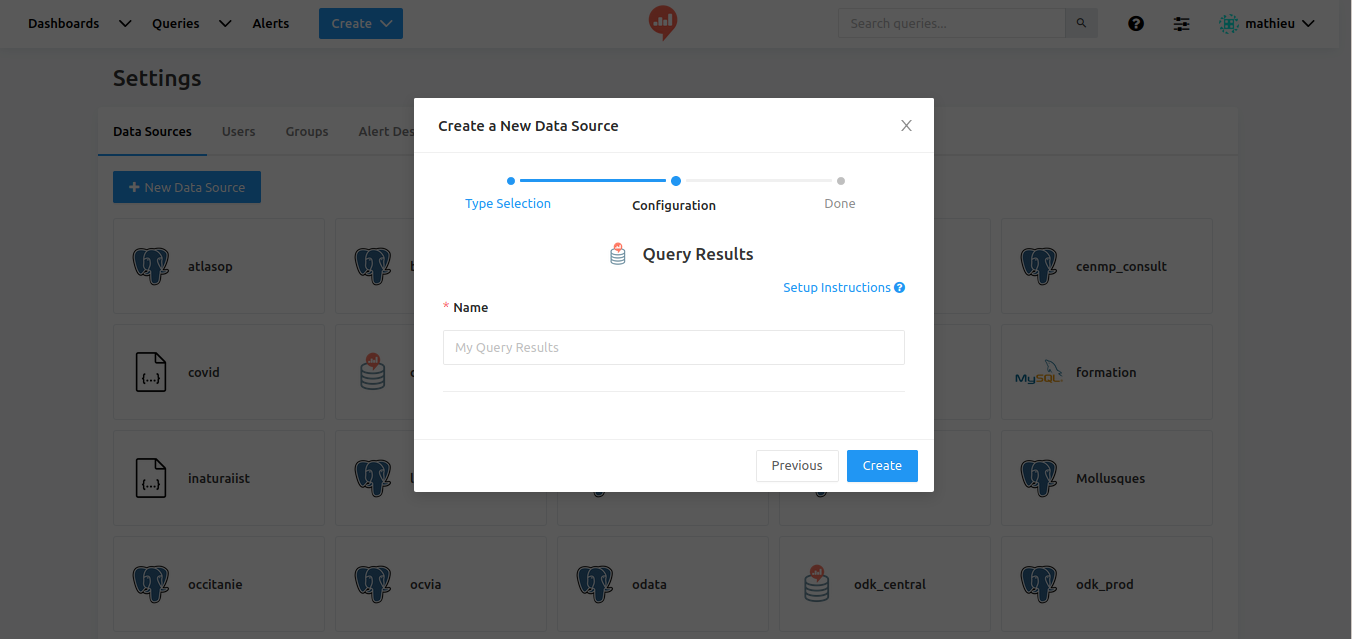
Redash offer the possibility to query a cached query result with SQL Syntax (the query result is "cached" in a sqlite database"
And query for all the needed columns :
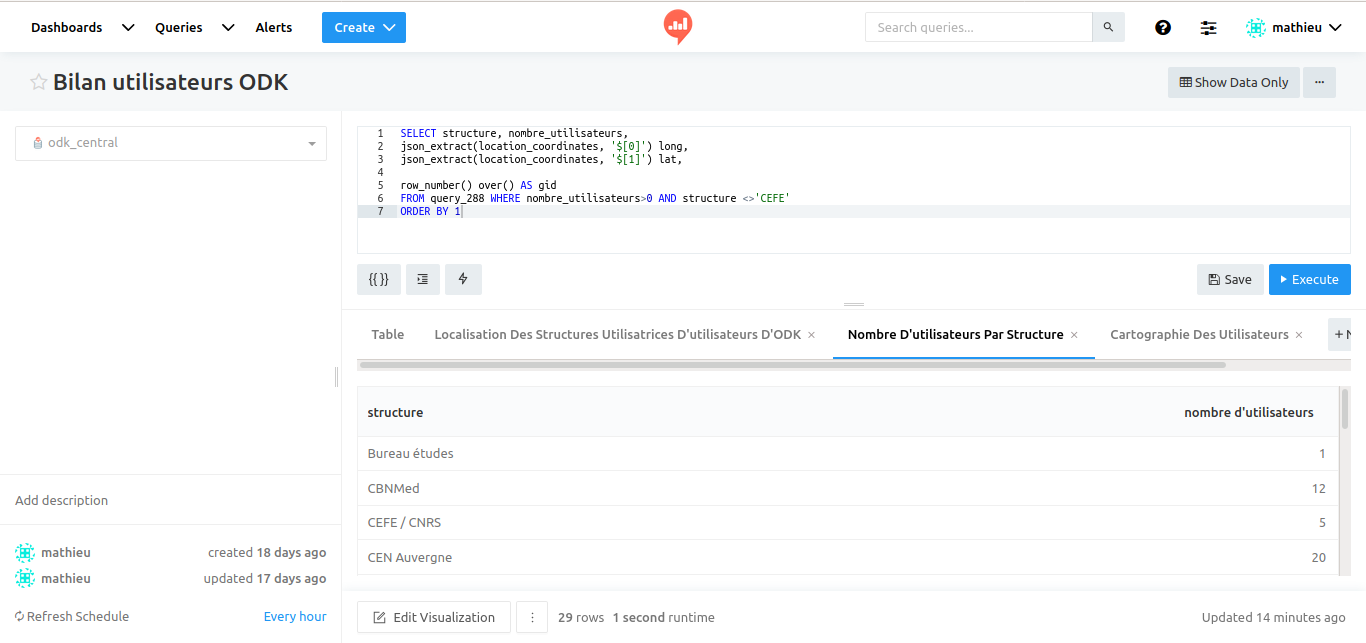
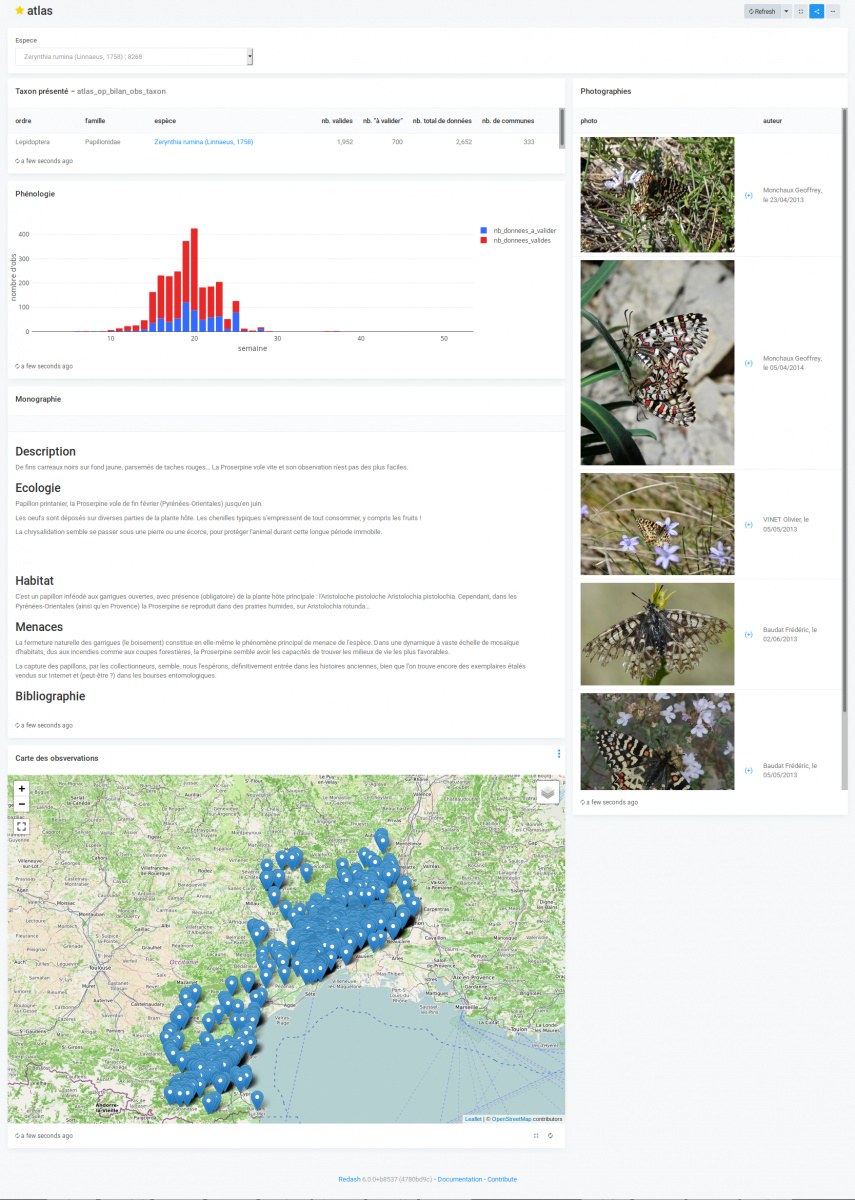
Now I can generate visualizations (a counter, a table, a map) and organize it into a dashboard. I that example we do not use any parameter. If it was needed, the parameters for each query in the dashboard can be set on the top of the dashboard and propagated to each query.
On big datasets, filtering Odata service will be an important step to avoid big data load, to be finally filter on the dashboard side.
Another more complete example (over a PostgreSQL data source):
Let me know if you want more precise explanations.