We currently have an ODK Central server set up and operational. Data is being collected through various forms using ODK Collect. These forms include a mix of textual information, geographic coordinates, photos, audio, and video recordings, all of which are stored on the ODK Central server.
We are looking to develop a dedicated website where managers can:
Access visualized reports based on the collected data.
View location data on interactive maps.
Review photos, audio, and video files directly from the platform.
The objective is to create a user-friendly interface that allows for efficient data exploration and review.
Would you be able to assist us with this project? If yes, we would appreciate it if you could share:
Your experience with ODK Central, APIs, and data visualization.
Examples of similar projects you’ve worked on (if any).
Your approach to implementing the required features.
Looking forward to hearing from you. Please let us know your availability and any questions you may have.
Best regards,
Naeim Dzhumaev
Whatsapp: +992988807776
S&Co, Dushanbe, Tajikistan
@Impro_SD
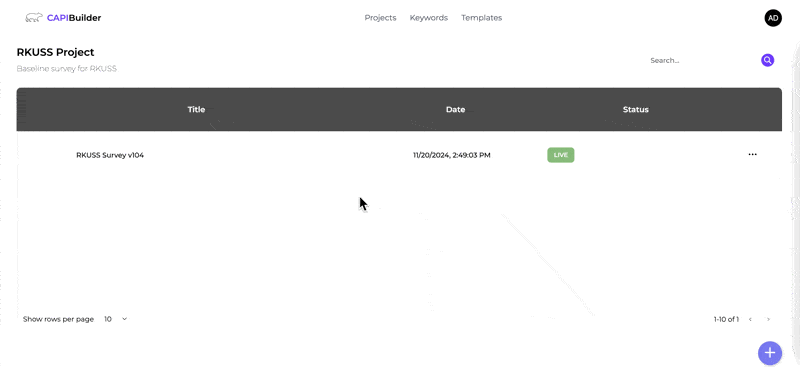
Here is an example of an ODK data submission dashboard available at https://app.capibuilder.org, an open-source ODK form builder application. The dashboard is primarily aimed at helping the Project Manager monitor the ongoing data collection project rather than presenting the survey findings.
There aren't many great options here, outside of building your own custom website.
It may sound basic, but have you tried PowerBI linked to the ODK OData feed?
Its quite a powerful tool, with lots of configuration options. You could distribute a pre-built dashboard .pbix file to your project managers. It's the simplest approach I have found
We (Quartex technologies) have developed a data verification and visualisation platform for our ODK projects. We are still using ODK Aggregate, but the principles would be the same for ODK Central. The data is presented as maps, charts and tables, and there is access to images. Reports (RDLC) and dashboards (Supersets, Looker) can be embedded for each survey. Please let me know if you would like some additional information.