What is the general goal of the feature?
To have a slider widget with text instead of numbers at the ends of the range bar and without the label of the numeric value on top of the bar. So basically it would be a slider allowing respondents to indicate a 'preference' in between 2 text values (more of A, more of B or somewhere in between). This would give a numeric value as output (without showing the label of this output on the screen). So, it would be an adjusted form of the 'range widget'
What are some example use cases for this feature?
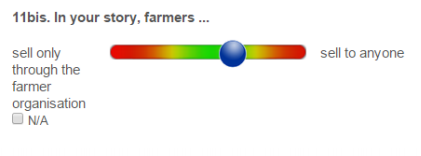
This feature could be used for quantifying the output of qualitative questions. Respondents can be asked to position themselves or their story on a continuum between 2 opposites. The position of the slider corresponds with a value (which is the output, not shown on the screen). This is a feature which is used to let respondents evaluate their 'own stories'. The respondents position themselves on this continuum by using the slider. Please see the example below:
What can you contribute to making this feature a reality?
We are very happy to provide you more info on the use of such type of questions.
Thank you all to see this feature request for discussion.
To add more information ... , we used slider with label for likert scale questions types, with label "Strongly Disagree" in one end and "Strongly Agree" in the other end. I will share you the screenshot of the application which was used for PMA2020 projects. Thanks!
How would you envision the colors of the slider being determined? Could these be hardcoded - eg always red at both ends with green in middle, as in your diagram - or would these needs to be configurable per widget? Asking because colors can often convey an implicit bias (eg green=preferable/'good', red=undesirable/'bad') and they would appear to play a not insignificant visual role in your example. Or should the slider be a neutral color? ...
I know the SenseMaker App from Cognitive Edge uses these type of questions. I think they call it 'dyads'.
We are looking for a range rather than values (so, not like a likert scale, but a range from let's say 0 to 100).
Hi, thanks for your feedback. The colors are helpful, but not a first priority as such. I think they could help the respondent in using the sliders (especially visualising the "centre" of the slider bar).
We are looking for a similar feature in ODK. The closest in ODK is the range integer widget, except that we do not want integers, but just extreme values at the end. We intend to use this to measure the degree of agreement or disagreement with less text and without the need to explain what 1,2,3 etc mean. We would want to measure distance from one end as the data of interest. I am not sure if this is the same way @Toon_Driesen will measure the data. In the clinical field, this type of tool is common in pain research as a visual analog scale. @yanokwa - Here is an example forpain (see the third graphic)
I dont believe there anything in the W3C definition of range that restricts it to integers. Indeed (emphasis added):
..Data Binding Restrictions: Binds only the following list of datatypes, or datatypes derived by restriction from those in the list: xsd:duration, xsd:date, xsd:time, xsd:dateTime, xsd:gYearMonth, xsd:gYear, xsd:gMonthDay, xsd:gDay, xsd:gMonth, xsd:float, xsd:double, and xsd:decimal.
Could what you want be accomplished leveraging the existing range control definition, but with the addition of specifying optional labels to be displayed in addition to (or instead of?) the start and endvalues? eg
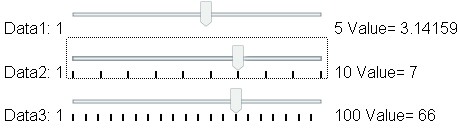
I think with a suitably small step (0.0001) you can effectively make the range 'continuous'... The step simply states the granularity of the actual returned value, and if you are most interested in, say, specifying 0..10 then I dont think the difference between, say, 5.1234 and 5.1235 is really going to be an issue. eg from wikibooks
A 'Data1' widget would seem to be what you are after, right? (provided we can add optional endpoint text labels)
Please note, this is simply the XForm W3C spec definition of range; it doesn't necessarily mean XForm clients like ODK Collect, Enketo, etc fully support it. But my point is that we can probably accomplish what you desire by suitably extending the existingrange control definition (and implementing whatever aspects thereof are current lacking in clients), rather than having to come up with an entirely new control type.
Also to note that the range widget shows the start/end values as well as the selected value. Adding optional start/end labels shouldn’t change this standard behavior. Therefore you’d probably want to add a (new) appearance to, say, hide the 3 values, so that you would only see the labels.