Welcome prospective Google Summer of Code or Outreachy participants! Please use this thread to discuss your ideas for the ODK Briefcase - New export types project.
Introduction
Expanding export and automation options from Briefcase will make it easier for organizations to react to the data they collect in a timely way. This project could include adding:
New export formats such as SPSS and Stata
Configuration options for ease of use such as flattening repeats, only exporting columns with values or using question labels as column headers
Requirements: Java experience; testing experience preferred; experience with data analysis tools like SPSS helpful Repository: https://github.com/opendatakit/briefcase Difficulty: easy Mentors: Guillermo Gutierrez (@ggalmazor) , backup: Yaw Anokwa (@yanokwa), Dave Briccetti (@dcbriccetti)
General guidelines for Project proposals
Start working on your proposal now.
Publish a draft as soon as possible. This way you'll get feedback faster and you'll be able to iterate and improve it.
Your internship only lasts for three months. Your proposal has to include an incremental delivery strategy that enables you to show results during your internship. To achieve this, you can:
Break the project into as many deliverable pieces of work as you can.
Break each deliverable piece of work up by different levels of detail.
Sequence your timeline to deliver low-detail work first and then iterate over to add more detail.
Example: First deliver a new, hard-coded export type, only available from the CLI, then deliver a new option on the Swing UI, then abstract over the two export types and deliver the third export type.
You will get feedback each time you deliver something, which could make you change your original plan.
Your proposal must acknowledge for what you know and what you don't know. For those things you don't know, plan ahead for timeboxed technical exploration tasks.
Example: If you don't know how to write a file in SPSS format, before starting to work on some feature that will require it, plan some hours to write a small test that will produce a file with some hard-coded data, and show it to your mentor.
As always, you can ask for help on the Slack channel, and it would be great to have your questions, links, and resources you find while working on your proposal on this thread as well.
Thanks, @yanokwa! One thing that's interesting about exporting to statistical packages like SPSS, Stata, and R is that you can try to export the form metadata in addition to the submission data. For example, odkmeta imports the submission data CSV files to Stata, using the field names as the Stata variable names. It also attaches field labels as Stata variable labels and notes, imports choice lists as value labels, splits select_multiple variables, and formats date, time, and datetime fields as Stata date and time variables, among other manipulations. Data analysts can spend a significant amount of time adding that metadata to their data sets, so it can be useful to export it along with the data.
I couldn't find any Open Source Java library for writing SPSS files so we will have to implement an SPSS Writer from scratch right? The format specification is not very clear - "SPSS does not openly publish the specifications of their proprietary file formats.". Though people have implemented writers for it SPSS Writer so we should be able to do it though I am confused where to start from. I have experience writing to csv (Java) but can someone help me to get started here?
My guess is that it would be a significant lift to build a writer from scratch for any of the statistical packages.
SPSS, Stata, and R all have their own statistical programming languages that include commands to import data and attach metadata. For SPSS, this code is saved in SPSS Syntax (.sps) files. Rather than writing a .sav file from Briefcase, another option could be to generate an .sps file to import the submission data and/or attach the form metadata. The ODK user would then run that .sps file from within SPSS.
KoBoToolbox takes that approach for SPSS, for example: see here. KoBo asks the user to export two files: (1) the normal submission data and (2) an .sps file to attach metadata. Users import the submission data, then run the .sps file.
SurveyCTO takes a similar approach for Stata: see here. odkmeta, which I helped develop, also generates a Stata do-file (not a .dta file), though it does so from within Stata itself.
Generating a script rather than a data file might also be an easier approach if the data format specification changes regularly, as is the case with Stata. In many cases, even if the data format changes, scripts will run without change. Exposing the metadata import in a script also gives the user the chance to modify the script as they see fit.
However, generating a script is not the only option. For example, Ona exports SPSS .sav files, not .sps files (see here). Generating a script also adds an extra step to the import process: the user has to run the script. Some beginner users of a statistical package might also get confused about how to run or troubleshoot the script.
Even I feel that as a user I would want to have a file which I can directly load into SPSS without needing any second step. Though I couldn't find any proper documentation for writing a .sav or .por file on the official website. @ggalmazor What do you say?
In the past, when I've had to write out an SSPS .sav file, I've used savReaderWriter which is a Python library that is pretty great. A quick search reveals that Ona uses it too which makes sense because Ona is written in Python.
Bundling a Python runtime with Briefcase would be a bit of a hack (and increase the binary size by about 50 MB), but it might be reasonable to ask users to install Python and then enable that export to SPSS if they want.
For GSoC, I'm a big fan of starting small and incrementally adding complexity. Exporting the data and including a script seems like a good way to start small.
I understand that right now in briefcase repeat groups are exported to a different CSV file with a key to the parent form. So if we are flattening the repeats do we put everything in the same 'main' CSV file under independent columns or is there a better way of doing this?
So if we are flattening the repeats do we put everything in the same ‘main’ CSV file under independent columns or is there a better way of doing this?
It can depend on how that CSV is going to be consumed.
If users want to work with it on excel, an independent column for each repeated field would work. Say that field A is a repeat group with one instance with field B and a nested repeat group C with two instances with fields D and E. Then, the CSV would have columns:
A_1.B
A_1.C_1.D
A_1.C_1.E
A_1.C_2.D
A_1.C_2.E
The total number of columns would be dynamicly based on the maximum amount repeated answers and nesting levels
If the CSV is to be imported on a database with JSON support like PostgreSQL, encoding the repeats into JSON in one column would work.
Since some of the possible new export formats are privative, I wanted to open a discussion about the options we have - especially to verify the work we are going to do here. Some questions we need to answer are:
Do people contributing to this new feature have to have access to SPSS / Stata? How do we achieve this?
How are we going to automatically verify that the output format is correct?
Do we need extra specific QA manual tests for this?
Regarding flattening repeats :
There are two approaches I could come up with-
Using 1 line per submission and adding new columns for each combination of repeat instances and columns. The problem with this approach is mentioned by @ggalmazorInternship project: ODK Briefcase - New export types - #10 by ggalmazor
This can significantly increase the no of columns in the CSV(as the complexity of nesting increases) but the advantage is that each observation is just one row.
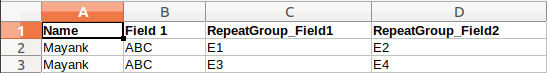
Using different rows to represent each repeat group instance.
Here, the person Mayank added 2 instances of the repeat group.
This approach is not exactly "flattening" the results but serves the purpose of fitting everything on a single csv without increasing the number of columns.
@ggalmazor ODK does not have licenses to STATA or SPSS. A short-term solution is for students to use a trial license which lasts 30 days.
While that is ongoing, we can put a call out to the community to see if we can have get access to a few community member's licenses for a few months. Perhaps @Matthew_White can help here on the Stata front?
I'm not sure this is the best approach, and it requires some manual effort, but for each odkmeta test, I've followed these steps:
Import a form's submission data by using odkmeta to generate a Stata do-file and running the do-file.
Manually check the resulting Stata dataset to make sure that it has been imported as expected. Follow these steps to do so.
If the dataset has been imported as expected, save it in the repository. For the test, run odkmeta to generate the do-file, then run the do-file, then compare the resulting dataset to the manually checked one that is saved in the repository. They should be the same.
I actually don't have access to a Stata license at the moment, but I think you're right that someone in the community must. I also think it's possible that Stata would donate a license if we contacted them.
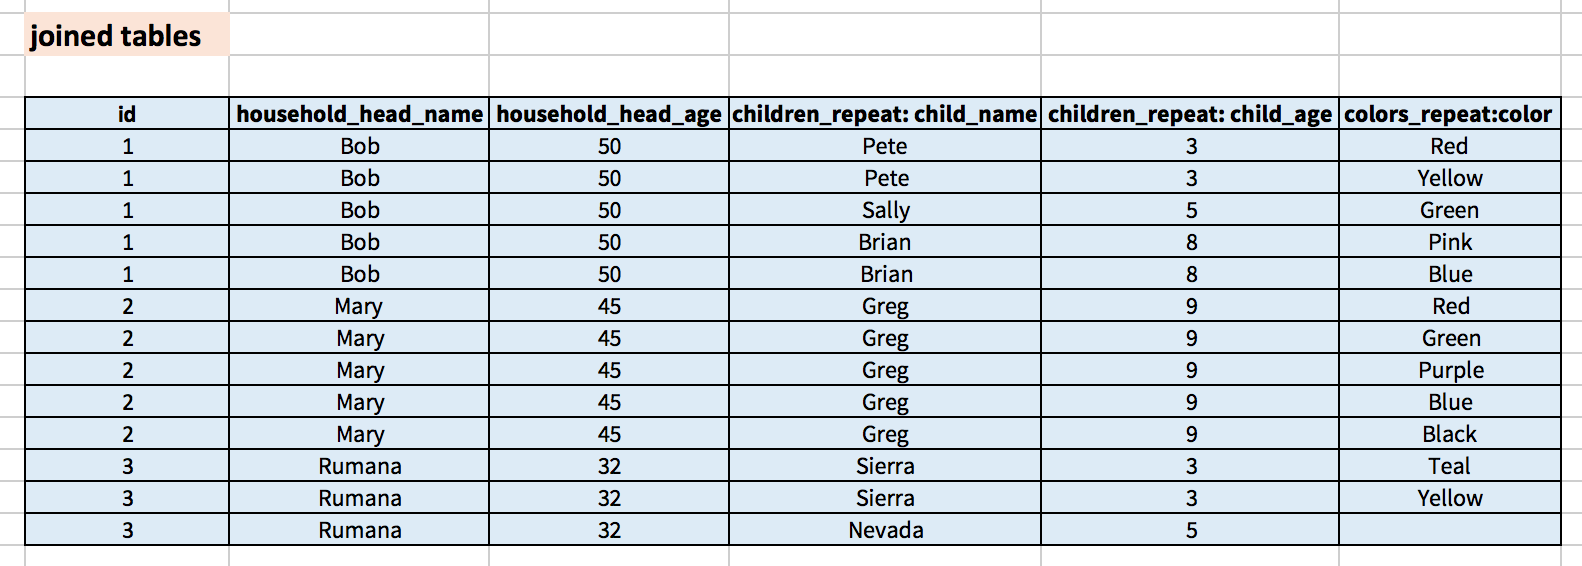
Just thinking out loud, what would the resulting file look like if there are multiple, unrelated repeat groups? For example, a farmer who has multiple children and multiple plots of land. If we ask questions about the farmer (name, age), their children (name, age, favorite color), and their plots (size, crop type) such that there is a repeat group for the children and a separate repeat group for the plots, what would each row of the file represent?
That is a very good question. I couldn't come up with a good solution for this case. If we display all possible combinations (that would be no of repeat_group_instances in RG1 * no of repeat_group_instances in RG2). This doesn't seem to be a good solution but I cannot think of anything else. One website(http://www.novixys.com/SwiftXML/flatten-xml.html) that I came across gives a similar solution, though it doesn't talk about this scenario. What would you suggest? How does this work in Google Fusion Tables? Maybe someone who has used it might be able to shed some light on this?
I think your first approach (one row per submission) is preferable in many cases for data analysis in Excel or a statistical package: analysts often tend to prefer wide data sets. It's actually pretty rare that I've run into the limit on the number of columns in Excel or Stata. However, like Yaw said, it does happen, and it's probably more common in other tools. Maybe in that case, the user could select a subset of fields or repeat groups to export?
But then that approach is not applicable for all cases, right? Suppose there exists a repeat group RG1 and there is one such form submission which has X no. of instances of this RG1. Here X is the minimum no of instances required to max out the column restriction. So, that approach of fitting everything on a single row won't work here. What do we do in this case? What I want to say is that this is not a universal solution and so is this the most user friendly way of doing it?
Ah, I see what you mean. I think ideally, we would know the maximum number of instances of each repeat group at the time the user is selecting the subset of fields. That way, we could show them the expected number of columns based on their selection. If that's not possible, another option might be to display the number of columns at the end of the export. If the number is too high, they can retry the export, selecting a smaller number of fields.
I think one high-level question is: who are the intended users of this functionality? If some of the primary users of this functionality will be those working in Excel and statistical packages, and the output of the first approach tends to best facilitate their data analysis, my personal view is that we should do what we can to provide it for them. From what I can tell from a quick glance, it seems that most servers in the ecosystem that support flattening take this first approach.
However, it's certainly possible that there is a group of users who would prefer the output of the first approach, yet because of the limit on the number of columns, would find the first approach infeasible, even with field selection. Or it's possible that there is a group of users who, even without the limit, would actually prefer the output of the second approach and find that it best facilitates their analysis. It'd be interesting to learn more about such use cases. As part of that, it'd be interesting to hear thoughts on how to address the question of unrelated repeat groups.