Who we are:
The ANB (Agentschap voor Natuur en Bos) is an agency of the Flemish administration in Belgium. It is an agency with multiple tasks. We give advice to private forest owners, we give permits, and subsidize management of nature and forest expansion. We exercise police powers concerning offenses against nature. ANB also manage all public forests and nature reserves in Flanders, in total 93.000 ha. (Agentschap voor Natuur en Bos ; Dienstensite Natuur en Bos :Beleid, info en dienstverlening)
This area is managed following adaptive nature management principles (read Mike Alexander). Adaptive nature management is in fact a PDCA cycle (Plan Do Check Act).
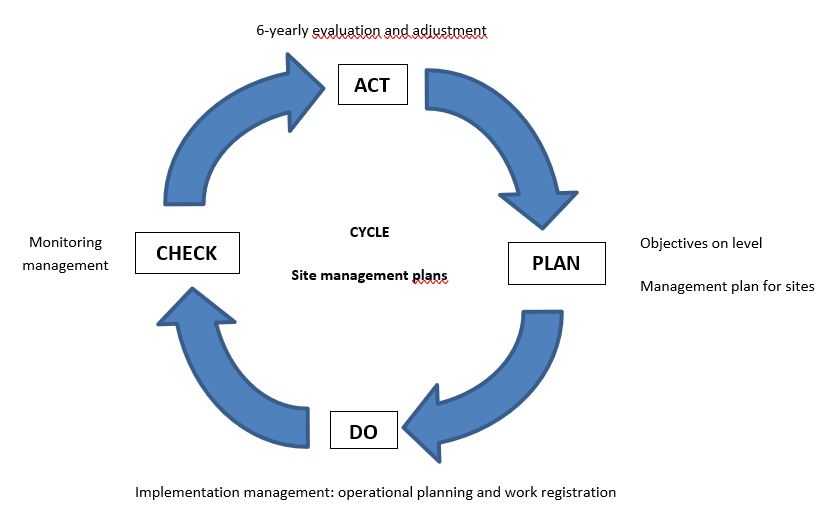
PDCA cycle
We make long term management plans, for 24 years, which indeed is long, but these are evaluated every 6 years. Every objective in a management plan is monitored in a six-years cycle. Evaluation can lead to whether or not adapting the management, or – worst case – lead to changing the objective itself.
Monitoring had been neglected or mishandled for a long time. It is a task everyone wants to do, and understands the need for it, but no one has time for it, or no one has the time to coordinate it. It is only recently been implemented in the ANB workload. Since 2019 we were testing the methodology our scientific institute(INBO) developed for us and testing field recording systems (old fashioned paper, excel, ODK-collect). In 2020 we adapted ODK-collect as a suitable system that met our needs for the management Check and Evaluation phase.
Our team is a support team that helps other ANB-teams in making management plans and performing monitoring tasks such as groundwater-level monitoring, vegetation mapping and vegetation monitoring. We are also responsible for the National Forest Inventory and partially for Natura 2000 monitoring. We use ODK only for the management monitoring.
How we met ODK
The ANB has a lot of tasks, and only limited resources. So does our IT-service. In 2020 no budget was available for what we needed which lead to the fact that our team went, out of necessity, for ODK-collect, without support of IT. We had previously had a positive use of ODK-collect for a small enquiry and our test of excel on mobile for the purpose of vegetation inventory was not so good. ODK-collect was very attractive for us because of the freedom and possibilities it offers in making customized forms.
What we use ODK for
We do use ODK for inventories of vegetations, trying to assess the quality of Natura2000 habitats and monitoring of management of the same habitats. We have a form for every habitat-type in Flanders (78 forms) and needed those forms to be very user-friendly as not only professionals, but also volunteers need to work with them.
A form for a classical vegetation inventory is not very difficult: one needs to make a list of the plant species present in a plot (in our case: a 20m x 20m square), and give each species a coefficient that says how much this species is present in the plot (coverage). Normally such vegetation recording are centrally desktop processed, a report is written and sent to whom it interests. Such recordings could be done by anyone having enough botanical knowledge and the analyzing and reporting could be done by someone with enough ecological, vegetative and nature management knowledge.
But we deliberately chose a different strategy. First we wanted the impact of the evaluation to be stronger by choosing that the vegetation recording itself is done by the nature manager itself. At ANB these are the rangers (boswachters). They decide how and when management tasks are done. Secondly we wanted the rangers to get immediate feedback once the vegetation recording done. So the forms we've built include the analytics.
What are these analytics? The vegetation recording is checked for presence of indicator species and calculations are made using the coefficients to be able to say something about quality of the vegetation, in view of the chosen objective: which is a Natura 2000 habitat type. These indicator systems were developed by INBO (Instituut voor Natuur en Bos). Two indicator sets are used:
- The LSVI-indicator set (LSVI = Local conservation status)
- The Species Baskets indicator set
After testing in 2020 we started implementation in the terrain management service of ANB in 2021. Rangers are supported in this task by one-site guidance by specialists who train them in methodology and species recognition. After each recording an evaluation moment takes place where all feedback-analytics are discussed and a conclusion is written down – does management needs to be changed or not, why and how? Our rangers are very pleased with this kind of approach. Immediate feedback is in fact a key factor in succeeding the implementation of management monitoring in our organization. This kind of support will continue until rangers will be able to conduct the field work alone. In 2021 166 releves were made, in 2022 490. The expected output for 2023 is about 700 records. If All our nature reserves and forests would have a management plan this amount would go towards 1500 recordings per year.
What do our forms do?
Our forms are divided in several parts/pages:
1 start page: contains a title, shows a picture of the vegetation and has two choice buttons (I will come to the use of those later)
2 identification of the management unit in which the recording will be done.
3 General data (so called header data) about the recording itself (date, enumerator, location, picture, …)
4 List of vegetation types present in vegetation plot
5 Input of each species present, in a repeat loop
6 Quality control page: appears only when values were missing in species input loop
7 Manual page: the coverage coefficients are listed and showed in clarifying sketches
8 Input of coverage coefficients for each species
9 Second Quality control page: appears only when values are missing in coverage input
10 Listing species in locally divergent spots in plot
11 Behind the scenes: calculation of indicator species present, and giving their coverage
12 Recording structure characteristics (different for each N2000 habitat)
13 Feedback page 1: evaluation according to “LSVI”-indicators (characteristic species, habitat structure, disturbance indicators)
14 Feedback page2: evaluation according to “species baskets”-indicators
15 Remarks and conclusions
16 Reminder for recording extra habitat
17 Standard end page
Workflow
- Ranger (enumerator) goes to the pre-selected zone in a management unit (got this on map), looks for a suitable spot for a vegetation plot and sets out the plot using compass, tape measure and some bamboo sticks to mark the plot corners.
- Enumerator opens the form on ODK-collect and starts to build the list of species present in the plot. After all species have been entered, each species is given a coefficient that represents the coverage of the species in the plot. Why do we not give the coefficient immediately when a species is entered? Because that does not work well. One has to walk through the 20m x 20m plot to find all species. While exploring this area one gets an idea of the coverage of each species, what is something one does not have on the moment one records a species.
- Enumerator reads automated feedback pages and eventually discusses with colleagues present.
- Enumerator writes down remarks, actual management, conclusions.
- Enumerator ends recording. Here are two possibilities: the form can be checked as “finalized” or not. When unchecked the form cannot be accidentally sent to the cloud storage (where the form cannot be edited due to too complicated for Enketo). Enumerator will choose unchecked if for example there were species present that could not be determined on species level. So the enumerator needs to come back at a better moment in the growth season to determine which species it concerns. Finalized is checked when a forms is completed and may be sent to cloud storage. But … it happens often that an enumerator only realizes she/he made a mistake, later on the day. When entering data in a next form he could see he entered a wrong species name, or even a wrong plot number in a former form. But no problem until ODK-collect v 2023.1, where finalized forms could still be edited.
- Enumerator sends (in the evening) finalized forms to the cloud storage.
The form itself: looking in detail to the xls-forms
Example form: Natura 2000 habitat: 6510-hu. Habitat 6510 contain species-rich hay meadows on lightly to moderately fertilised soils. It would be one of the most common grassland-types in Flanders but has disappeared from farming land due to fertilization in modern farming.
I'll highlight some parts that I spent a lot of time developing or that I needed external help (from the ODK-forum) with.
2 identification of the management unit in which the recording will be done
Line 14-18: This part uses an external lookup list, combined with cascade dropdowns. The list of management units is very long: about 23000 items. The management units are in a container-in-container hierarchy starting with “Regio” “Domein”,” Blok”, “Perceel” and “Beheereenheid” (= management unit). The total cascade lookup list contains 35000 items.
It uses a minimal search in the field list column: minimal search('select_level2023', 'matches', 'level', 'regios'). In the choices tab is referred to the names of the columns in the external CSV-table. We needed to store the ID-numbers in stead of the actual names of the management units because of the many doubles in the list.
Line 19-24: here the name of the management-unit is reconstructed using a pulldata calculation. In Line 24 a “name” is constructed using a concat calculation to concatenate “Domein”,” Blok”, “Perceel” and “Beheereenheid” as one string.
3 General data (so called header data) about the recording itself
Line 30: here we show a picture: an outline of a 20m x 20m plot showing it needs to be directed North-South and East-West, and that the most South-Eastern corner must be located with GPS
Line 31: this South-Eastern corner is recorded using a geopoint question.
Line 33: if for some reason (ex. Management unit very narrow) a 20m x 20m plot cannot be layed out, a plot with about the same surface needs to be drawed: recorded using a geoshape question.
Line 34: in the latter case: the drawed area is calculated using area calculation, divided and rounded to get in in hectares: round(((area(${geoshape1})) div 10000),4)
Line 36: with image we make a picture of the sampled vegetation
4 List of vegetation types present in vegetation plot
Line 39: It is easier and more clear to analyse the data when they only contain species data from one particular vegetation type. Dealing with long term monitoring in permanent quadrates this is a desire that cannot be maintained – nature changes constantly and vegetations shift. So some plots are rather divers and contain more than one vegetation type. Here one can choose with a select-multiple the ones present from a lookup list that is not too long to reside in the choices tab.
Someone analysing the data desktop knows as such that this recording is a divers one.
Line 40-52: the chosen vegetation-types are listed and from each the portion in the plot is asked (%). A combined choice-name and selected-at formula is used as calculation:
jr:choice-name( selected-at(${vegetaties}, 0), '${vegetaties}')
5 Input of each species present, in a repeat loop
Line 57: species names are chosen from an external CSV-table using a search calculation. The lookup list is external because very log: more than 10000 items. The search calculation is combined with a ‘contains’ function to get all the species names, that contain the text the enumerator entered in line 56: soortk. That way one can enter any part of a Dutch plant name or Scientific (latin) plant name to filter the long list of plant names:
search('soorten_hab2021', 'contains', 'dutchname_key, scientname_key', ${soortk})
Line 58: is a variant: here the list of species is limited to only the indicator species of the habitat concerned. The use of the standard or variant depends on the choice made on the start page: see Line 9.
search('soorten_hab2021', 'contains', 'dutchname_key, scientname_key', ${soortk}, 'H_6510_hu_key', 1)
6 Quality control page: appears only when values were missing in species input loop
In this section we look for missing values in the repeat loop: where the enumerator might have entered a choice text, but forgot to tick a choicebox of a species: as a result the entry is empty.
Line 62: the number of species entered is calculated: count(${invoeren_soorten})
Line 63: the number of empty entries is calculated: if(${s1}='',1,0)+if(${s2}='',1,0)+if(${s3}='',1,0)+ …
Line 64: with a concat calculation, combined with embedded if functions the entries which are empty are listed:
concat(if(${aantal_soorten}>0,if(${s1}='','soort1 /',''),''),if(${aantal_soorten}>1,if(${s2}='','soort2 /',''),''), …
Line 65: a warning text appears( if more than one entries are empty) listing how many and which entries.
Line 66: variant text of 65, for one empty entry.
7 Manual page: the coverage coefficients (management monitoring scale) are listed and showed in clarifying sketches
Line 69: scale
Lines 70-77: images that show how plants with a certain coefficient could be distributed in a plot
8 Input of coverage coefficients for each species
Line 80-89: with an indexed-repeat calculation the name of the species is fished up from the entered species in the repeat loop. It is combined with an If-function depending whether the enumerator chose for the total species list or only the list of indicator species of the concerned habitat (see Line 9)
if(${Keuzeknop2}=0, indexed-repeat(${soort}, ${invoeren_soorten}, 1), indexed-repeat(${soort2}, ${invoeren_soorten}, 1))
Line 91-100: entering the coverage coefficients with a select-one question.
Line 103-221: Why did I split the entering of coverage coefficients in different pages, 10 entries per page? The first versions of this form did have all this on one page. But for forms of habitats with many species in the plot and many indicator species and indicators to calculate, the forms where very slow. In some cases we had to wait 30 to 50 seconds before we could enter the next coverage. Splitting these entries in different pages helped a lot in speeding up the process.
For the same reason – performance problems – is the number of species confined to 60.
9 Second Quality control page: appears only when values are missing in coverage input
Line 223: calculating the number of zero-entries: where the enumerator forgot to give a coefficient to the species
if(${b1}=0,1,0)+if(${b2}=0,1,0)+if(${b3}=0,1,0)+…
Line 224: concatenates the entry-names so the enumerator can be told (on the next line) which entries were left zero.
concat(if(${b1}=0,${s1} ,''),'/',if(${b2}=0,${s2} ,''),'/',if(${b3}=0,${s3} ,''),'/',…
Line 225: : a warning text appears( if more than one entries are left zero) listing how many and which entries.
Line 66: variant text of 65, for one zero entry.
10 Listing species in locally divergent spots in plot
Line 229: Sometimes there are small zones in a plot were the abiotic conditions are different and other species appear (ex. a small higher and drier zone). Her one can choose the recorded species that are only growing in that particular zone. We use a select-multiple question working with a choice list in the choises tab which refers to the entered species.
11 Behind the scenes: calculation of indicator species present, and giving their coverage
In this section is looked if the indicator species of the concerned habitat are present amongst the recorded species in the plot, and its coverage coefficient is given.
This was a tricky section. Not for how to write it in xls-forms format, but the translation of species names needed to be done with care, taking the taxonomic level of the indicator in account.
It is a section which is not seen in the screens in ODK-collect, but together with sections 13 and 14 it has a big impact on the performance of the form. Forms with more than 200 indicator species became very slow when entering the coverage coefficients (lines 80-221).
12 Recording structure characteristics
Some indicators cannot be derived from the list of species present. Such are the structure indicators. These are different for each N2000 habitat. They are entered with simple select-one questions.
13 Feedback page 1: evaluation according to “LSVI”-indicators
Lines 363-411: This is the part that took a lot of time to write down in the xls-form format.
The LSVI indicators are a set of indicators that say something about the quality of the Natura 2000 habitats. The indicators are split up in characteristic species, habitat structure and disturbance indicators. For each indicator there are standards that determine whether the habitat is in good condition or not. This resulted in a lot of customized calculations.
Some examples:
Calculation of an “weighted average coverage” using the formula of Fischer:
1-((1-if(${Raaigras_G}='',0, ${Raaigras_G}))(1-if(${Witbol_G}='',0, ${Witbol_G}))(1-if(${Gewone_hoornbloem}='',0, ${Gewone_hoornbloem}))(1-if(${Kruipende_boterbloem}='',0, ${Kruipende_boterbloem}))(1-if(${Veldzuring}='',0, ${Veldzuring}))*(1-if(${Witte_klaver}='',0, ${Witte_klaver})))
Listing the indicator species present for a certain indicator: using concat:
concat(if(${Raaigras_G}!='','Raaigras (G)/' ,''),if(${Witbol_G}!='','Witbol (G)/' ,''),if(${Gewone_hoornbloem}!='','Gewone hoornbloem/' ,''),if(${Kruipende_boterbloem}!='','Kruipende boterbloem/' ,''),if(${Veldzuring}!='','Veldzuring/' ,''),if(${Witte_klaver}!='','Witte klaver/' ,''))
calculating the number of indicator species present of a certain indicator:
if(${Raaigras_G}='',0,1)+if(${Witbol_G}='',0,1)+if(${Gewone_hoornbloem}='',0,1)+if(${Kruipende_boterbloem}='',0,1)+if(${Veldzuring}='',0,1)+if(${Witte_klaver}='',0,1)
14 Feedback page2: evaluation according to “species baskets”-indicators
Species Baskets are a set of indicators derived from the LSVI-indicator set. On one side the large set of disturbance indicators where merged into two indicators: one that shows if abiotic factors are not suited for the habitat, and a second one that shows if management is probably not ok. The characteristic species indicator was withheld, but very difficult species were discarded, if possible.
New was the introduction of so called trajectory species: species that are not really characteristic, but can tell us if a badly developed vegetation is on its way of improvement.
The difference with the LSVI-indicator set is that there are no standards that say if the habitat is in good state or not. The species baskets system is developed for long term monitoring, where trend analysis tells us what is happening.
But anyway – this system showed also to be very helpful to say something about actual quality, by looking to the balance between the four indicator types.
Calculations that are performed are as in section 13: weighted average, number of species, concatenating species list.
15 remarks and conclusions
In this section the enumerator is asked to write down the conclusions of the evaluation, what actual management is done and if this has to be changed. She/he is also asked if according to what has been seen, the objective needs to be changed or not.
Line 443: As a help in remembering the management performed in the past: there is a long external CSV lookuplist where all recorded management is concatenated in one sentence per management unit. The record that is shown, depends on the in line 18 chosen management unit (cascade choice lists).
16 Reminder for recording extra habitat
Depending if one or more additional habitats have been entered in section 4, the enumerator gets a reminder to open a second form, for the extre habitat, and fill it in, thus evaluating the same vegetation according to the standards of the additional habitat(s)
17 Standard end page of ODK-collect
Download the form and media files here:
Here you can find the xls-form, 3 CSV lookup lists and 9 pictures to make the form work:
6510-hu.zip (3.4 MB)