For the past 5 month I was doing an internship with the Swiss Tropical and Public Health institute and my main project was developing an R package called repvisforODK which is in some way a continuation of what @chrissyhroberts showcased here.
Intro
The idea of repvisforODK was to develop a quick way to visualize data which is stored on ODK Central by creatings generic plots and even entire reports. To do so, the package leverages on a variety of other external R packages. I largely relied on ruODK (@Florian_May) for the interaction with the ODK Central API and both ggplot2 & plotly for plotting.
repvisforODK was developed to be accessible not only for people with but also for people without coding skills. Thus, repvisforODK can be used in two ways:
- Code solution: repvisforODK contains several functions that create plots for different question types. These functions can be used individually which enables the user to use them in whatever way fits best for their use case - visualize data on the fly, integrate in already existing code, create a new personalized report etc.
- No Code solution: All functions of repvisforODK are united in an integrated shiny app. The app provides an interface where the user can connect to ODK Central, select the visualizations they desire, set the required parameters and ultimately generate an html report.
Examples
Here are some exemplary images of the app and of some of the plots you can generate with just one line of code.
Plots
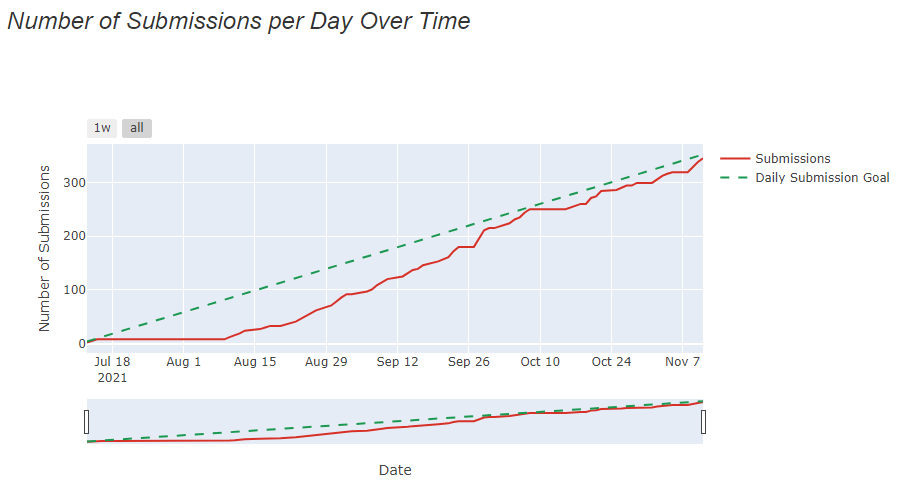
Submissions Over Time Line Chart (Cumulative)
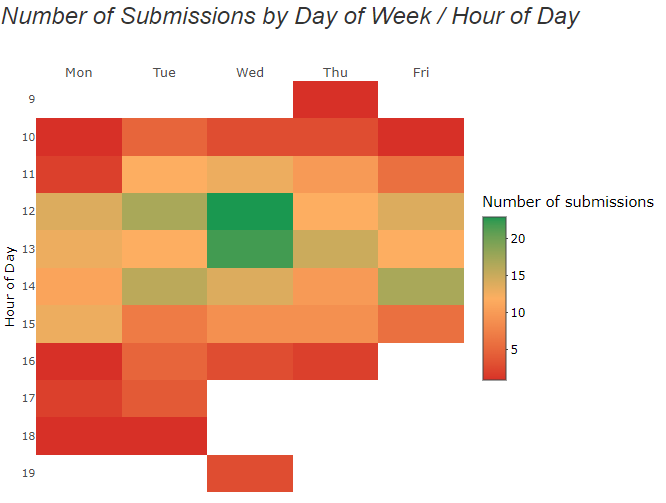
Day of Week / Time of Day Heat Map
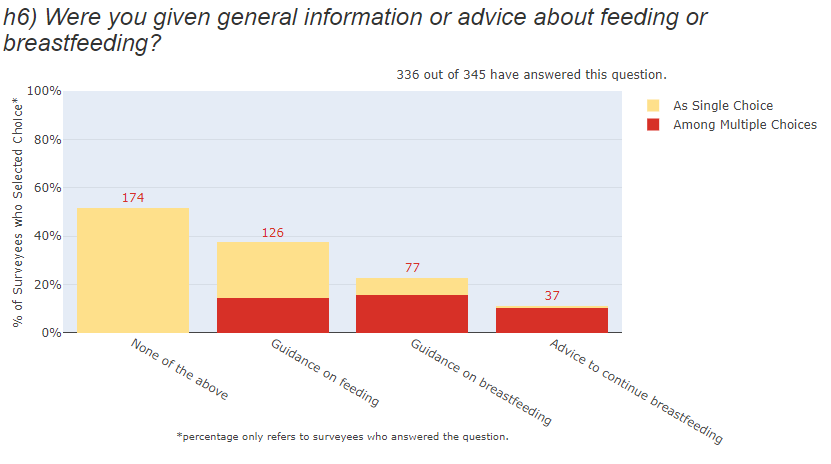
Multiple Choice Question Bar Chart
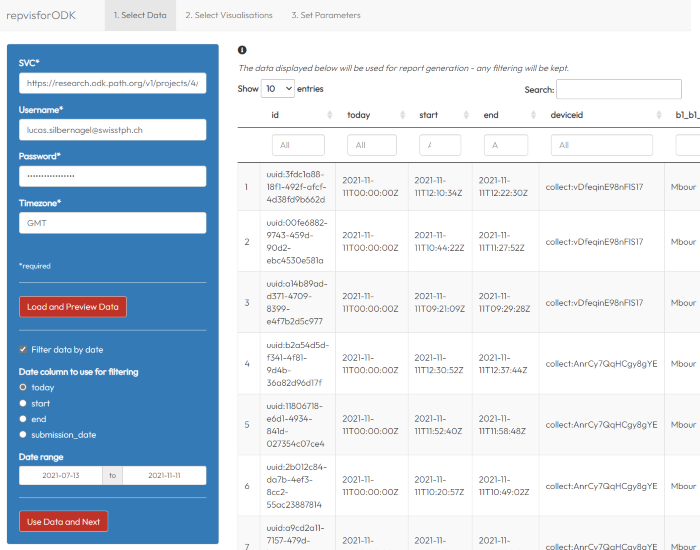
App
1st Tab: Here you connect to ODK Central to get data
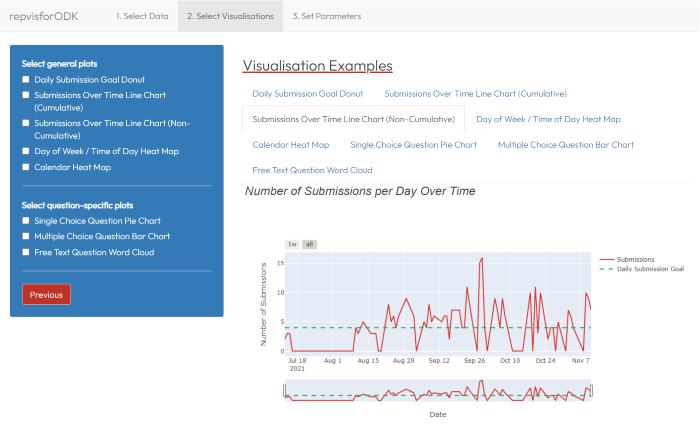
2nd Tab: Now it's time to select the plots you want to have in your report
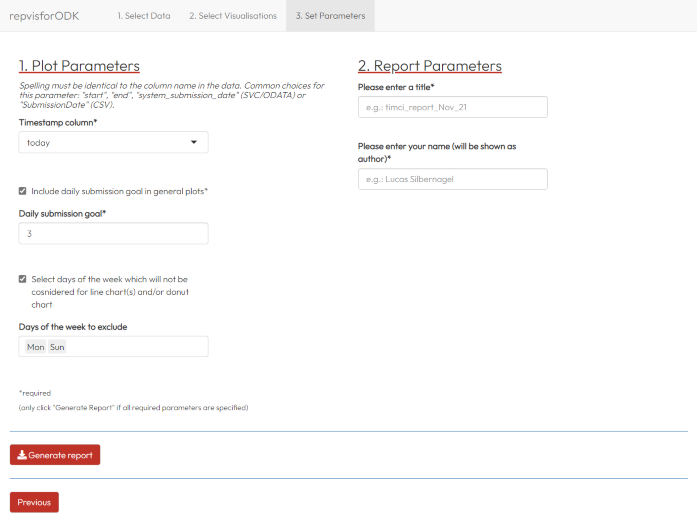
3rd Tab: Just specifying some parameters before you can generate your report
If you want to learn more, you can visit the GitHub. To get a good overview of the package and the app, I can recommend you to have a look at the recorded demo event which can be downloaded here.
Installation
The development version from GitHub can be installed using:
require("devtools")
devtools::install_github("swisstph/repvisforODK")
To install the dependency ruODK, you can use:
# Enable the rOpenSci universe
options(repos = c(ropensci = 'https://ropensci.r-universe.dev',
                  CRAN = 'https://cloud.r-project.org'))
install.packages('ruODK')
If you run into further problems when attempting to install the package, you can check out the how-to-install video tutorial. If this doesn't help, feel free to leave a post in the discussion section.
Cheers,
Lucas